Visa Bulletin – March 2024

March Visa Bulletin for the FY 2024 was released few days. Here are key insights and updates to it with some predictions.

How to use Demand Data to calculate EB3 to EB2 Porting?

As per visa allocation each year under each category, USCIS/DOL should use 233 visas every month for EB2-India. Normally this should reduce demand by 233 every month. Since we are not seeing any reduction in demand data, it suggests that there are many individuals who are upgrading their case from EB3 to EB2. So what is the rate at which EB3 to EB2 porting is happening? Simple Calculations that could be used to estimate this is ...

EB3 to EB2 Porting with same employer: Not a good idea

These days it is been topic of the town for Indian nationals to port their priority date from EB3 to EB2 category. So far this totally makes sense. This could tremendously reduce the wait time for an individual to receive a green card. But an individual and his employer should be very careful while taking this step if they are planning to port the case with a same (current) employer. There are rumors that many employers are upgrading their employees’ petition from EB3 to EB2 category just to retain their employees.

I-485 Case Tracker for PDs 'Current'

We have released new I-485 case tracker for cases that are 'Current' today. Please use this tracker to enter details of your application and case status. Please fill in as much details as possible and edit the tracker as and when you will get more information on your application status. Use this tracker to see if PDs that has recently became current are getting approved

January 2012 I-485 Pending Inventory - EB Category Visa Use

USCIS released I-485 pending inventory upto 12 January 2012. Please note this inventory is only for Service Centers and Field Offices, and does not contain consular processing cases. Dependents are included. Here is a summary of the I-485 inventory when compared to October 2011 Inventory. This inventory is used to estimate the visa use during Q1 of FY 2012 and Projected Demand for FY 2012.Please note that one fallacy to using inventory to estimate demand is that it will not consider cases approved in less than 90 days.

EB Category Roll-Over and PWMB Demand: I-485 Receipt Data

We analyzed I-485 Approvals and Receipts for FY 2011 to estimate carry-over demand from FY 2011 in EB category. We also used this data in conjunction with USCIS I-485 Performance data and I-485 representative filings from June to September 2011 at trackitt to estimate People Who Missed the Boat (PWMB) demand for EB2-IC upto September 2011 that may start consuming visa numbers from FY 2012 annual allocation and/or spillover.

Prediction for EB2 Category for FY 2012

Here is the Prediction for EB2 Category cutoff date retrogression for Fiscal Year 2012. Basis for this prediction is simple calculations (see below) which is done based on available data i.e. PERM data published by DOL, I-485 Inventory data, latest trend on Trackitt for EB1 & EB2 cases and other published data by USCIS. Demand data for each dependent category is predicted and explained in calculations below. This data is further used to calculate spillover that would be available for EB2 category. Retrogression is estimated based on visa allotment available each year for each country and total spillover that is expected in FY 2012. In each case, Optimistic, Realistic and Worst-Case scenario is estimated.

Green Card Calculator - Employment Based

As per recent demand data released until September 01, 2011 on EB I-485 inventory, here is the 'Green Card' calculator for Employment- Based category that tells an individual how many I-485 applicants are there before them in the queue under their filed preference category. Beyond this, calculations are extended to predict how many years will it take an individual to receive a green card. In addition, you can put an assumption for a spillover that your category and country would receive every year and see how this changes the scenario.

What to do once Priority Date (PD) becomes current?

A very commonly asked question by fellow petitioners is the step by step process that they should follow after an individual’s Priority date will become current. Please read this article to check on next steps and required I-485 documents.

I-485 Primary & Secondary Evidence - Country Specific

Commonly asked question is what to do when primary evidence of birth, marriage, divorce etc is not available. Here is the country specific I-485 Required documents for (AOS) or (CP). Immigration officers or Adjudicators are asked to refer to the list below before making any decision on RFE or NOID in case primary evidence is not submitted or established. Please select your country from the drop-down list to see specific secondary evidence and documents.

EB2-India & China I-140 Demand (Yearly) based on DHS Released Report

DHS on 29th December 2011 released a Citizenship and Immigration Services Ombudsman's recommendation to improve the quality in Extraordinary Ability and Other Employment based petition adjudication document. We used this data to deduce I-140 demand for EB2-India and China.

EB2-IC Movements FY 2012 - Mr. Oppenheim's thinking?

We looked into if there is any analytical correlation between movements that Mr. Oppenheim did last year for Family Based Category (F2A) and current movement that we saw with EB2-India and China for Employment Based Category. Is there any correlation or equation or factor that can determine how Mr. Oppenheim would think in absence of demand or visible demand in case number of filings that he is receiving or available adjudicated case cases are less? That is when we started digging into this.

AC21 Portability - FAQs and Sample Letters to USCIS

Some people suggests that sending letter to USCIS on job change after invoking AC-21 portability is not required. But this is a gray area, and no one knows it better if USCIS should be informed when individual would invoke an AC-21 portability to change job once applicant's I-485 is pending for more than 180 days with USCIS.

Understanding Section 245(k) to use it for Derivative applicants after Primary’s I-485 approval

Common question asked by many primary I-485 applicants who had previously filed I-485 Adjustment of Status (AOS) application, which is still pending with USCIS, is about adding their spouses or children (derivatives) to their pending I-485 application. At this point there is always a concern among the petitioner that their case will be approved before their derivatives application

July 2012 Visa Bulletin Predictions - EB Category

Here is the prediction for July 2012 Visa Bulletin. We should see following movements in each category as long as USCIS/DOL would use visa numbers as per statutory allocations.

EB2 India & China - What to expect in FY 2012?

Cut-Off Dates has reached PD 15th April 2007 for EB2-India and China for FY 2011 in September bulletin, now what can we expect for FY 2012?. We have some analysis to estimate movement in FY 2012. This is very rudimentary as of now and can change as FY 2012 will progress.

EB3 ROW-Mexico-Philippines - What to expect in FY 2012?

For FY 2012, EB3-ROW-M-P is expected to move together similar to the movement that was seen for FY 2011. Based on available I-485 inventory, last released demand data, and hidden demand (or Consular Processing demand) that was observed in FY 2011, total EB3-M-P demand until ....

How to know if old I-140 has been revoked by previous employer?

If an individual filing a green card under employment-based category has changed job and now planning to port priority date from previous filed Labor certification, he/she will at least need an approved I-140 from previous employer to recapture priority dates. This I-140 should not be revoked and still active.

Understanding Visa Bulletin Cut-Off Date Determination

The State Department (DOS) is responsible for the allocation of numerically limited immigrant visa numbers under the authority granted by section 203 of the Immigration and Nationality Act (INA). These visa numbers are allocated based on congressionally mandated preferences that assign an overall total, limits for each category and per country limits within each category. Here is a quick Memo on the steps involved.

'Hard' vs 'Soft' LUD - How to use it to track your case status with USCIS?

If you heard people talking about keeping track of 'Soft' and 'Hard' LUDs on forums and other websites, and wondered what it is, now you can understand what is LUDs and how you can use them to track any activity on your petition that is pending with USCIS.

How to Obtain an Emergency Advance Parole (AP) Document?

If your current status is Adjustment of Status (AOS) Pending and you are currently working on EAD, it is very important that you renew your Advance Parole (AP) document in timely manner, well in advance. If an individual leaves a country under AOS pending status with their AP application pending or AP document due expire when they are traveling outside of country, they will abandon their status in United Status. Subsequently their I-485 application will be denied.

People Who Missed the Boat (PWMB) during July 2007

Question was asked in the comment section that how would applications with Priority date before July 2007 who could not file in July 2007 would affect EB2-IC movement for FY 2011. These people are commonly referred as "People Who Missed the Boat (PWMB)" by some people. We earlier thought that these numbers will small percentage of the whole group. But careful analysis of PERM data suggests that these numbers are significant when you will include primary + dependents (assuming a family would consume 2.5 visas) applications.

EB3 to EB2 Porting Calculations - Part III

We have a poll on EB3 to EB2 Porting which is up since last week of February 2011, and till-date we have received '445' votes. Results has been consistent through out the poll for the last two months. It suggests that the general trend or distribution of individuals with different PD that are porting has not changed from day to day regardless of number of votes received.We are convinced that this will be a general trend for rest of the current year regardless of porting numbers. Calculations are further extended to extrapolate real world numbers.

H1B FY 2012 CAP Count & Predictions

As per recent release by USCIS, regular cap has utilized till date 11,200 visas and Masters quota has utilized 7,900 visas as of 13th May 2011. It is interesting to see that H1B visa under Master Cap has utilized more than 35% of the quota. As of now number of petitions increased from last week is 1,600. Based on past months trend, regular cap can reach by 27th January 2012 and Masters Cap by 30 September 2011.

H1B FY 2012 : List of Disqualified Employers

H1B FY 2012 season will be here soon. It is advisable that the prospective aspirants for H1B FY 2012 should be aware of the debarred or disqualified employer for this season. Please make sure you do not become a bait to any of these employers for your H1B filing. These employers are willful violator employer and are black-listed.

PERM Processing Time Starts to Slump

DOL recently released current PERM processing times. It looks like fire-sale is almost over and PERM processing time will again start creeping towards 1-2 months wait or more in coming months. 5 days approval will be a history. Temporary Government shutdown is still not in effect and this will delay the processing time further when some decision about it will be made during April 8, 2011. The Senate votes to fund the federal government through April 8. But the stalemate over 2011 spending remains, and no one wants to pass another short-term stopgap. Is the stage now set for a government shutdown next month is yet to be known.

Document on Tax Exemption for OPT Students and Students on F1B visa

Document or proof stating that OPT students are not required to pay Social Security Taxes and Medicare tax. You can share this with your employer

What is H1B 'CAP Exempt' visa?

Most of the international students after graduation would focus their attention to find a job in corporate world. But it is always difficult to find an employer who will be ready to sponsor your H1B visa. If you are lucky, you may find an employer who is willing to sponsor your work visa, but could not do it because quota is not available at that time or if quota is open, is worried that he may have to wait until start of fiscal year in October before you could begin working for him. What are other options in such case? Well in this case, you can opt for working for organizations that are exempted from H1B visa regular cap quota.

Showing posts with label EB2. Show all posts

Sunday, February 26, 2012

Adjusted EB2-India & China FY 2012 Retrogression Estimation based on I-485 Receipt Data

Posted On Sunday, February 26, 2012 by Rav 41 comments

Based on newly released USCIS Receipts and Approvals for Q1-FY 2012, we would like to adjust the estimation of retrogression for FY 2012 for EB2-India & China Category. This time we were fooled by USCIS January 2012 Inventory which in reality is nothing but a muck of mislaid data. Either USCIS inventory was incomplete in terms of November 2011 and December 2011 to an error of greater than 50% or currently released document has some error. Most likely at this point January Inventory looks incomplete not only with respect to December 2011 visa bulletin movement data but to great extent to November 2011 data. In any case, at this time we feel dejected to outline that we are back to square-one where we started for FY 2012. If any of this is accurate to 80-90%, we are talking about severe retrogression.

Visa Usage or Approvals from the released data 
Currently released data suggests that atleast 31,541 visas were used in Q1-FY 2012. This looks reasonable based on estimated visa use that was published few months ago. 

Estimated EB2-IC visa use upto Q1-FY 2012 is 8000+4805 (PWMB). Also for EB3 category at least 15% or more visa is used by Consular Processed (CP) cases, so monthly visa use is 0.85*3367 = 2861 per month at USCIS. For 3 months it becomes, 2831*3 = 8,493. EB4 could have used 2495 or more in Q1 and EB5 has used 2864 based on released data. Estimated from January Inventory, EB1 and EB2-ROW-M-P use was  around 3,580 and 2321 respectively.
 
Visa use in Q1-FY2012 =  3580 + 8000+ 4805 + 2321+  8493 + 2495 + 2864 = 32,558 (approx 31,541)


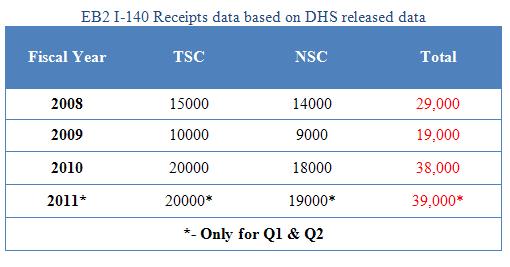
EB2-IC Receipts from the released data 
Most disturbing and contradicting to January Inventory data is the total EB category receipts issued in Q1-FY 2012. YTY we had seen that total I-485 EB Receipts at TSC and NSC were 27% - 33% of total I-485 receipts at these service centers. Well current data suggests that when EB2-IC cut-off dates were moved so much in last 6 bulletins, this is no longer true. EB category receipts due to such huge movement now estimates as large as 50%-60% of total I-485 receipts at these centers.

Based on EB receipts for each month as per currently released data, and current trackitt trend for filings in each month for Q1-FY 2012, EB2-India & China demand estimate has almost doubled than what was estimated earlier just because of I-485 EB receipts now representing 50%-60% of total receipts and not 27%-33% anymore. Tabulated results is based on taking EB2-IC trackitt data as it is and assuming EB1 and EB2-ROW-M-P  representation is 1/4th of that of EB2-IC on trackitt. See this article for reference on how this is calculated.

 EB1 and EB2-ROW-M-P estimation above jives well with new applications estimated from January Inventory. Estimation from January 2012 Inventory falls atleast 20% low again because of incompleteness.

One fallacy to above method is that we have not considered any EB3 to EB2 Porting and any new receipts for EB4 and EB5. Based on inventory EB3 to EB2 Porting is not more than 1800, and EB4 & EB5 demand is around 622+223 = 845. Assuming incompleteness of inventory, if we increase this number by 50% more, it comes out to be 845*1.5 = 1267. Though good chunk of EB4 and EB5 cases are CP cases we can ignore it at this point and assume all 1267 were filed at USCIS. Out of new EB2-IC cases, there will be few PWMBs too, which account for these receipts. Such number should be part of October receipts. Considering all these errors, EB2-IC demand for Q1-FY2012 comes out to be 23,787 - 1800 - 1267 = 20720. This is atleast 8000-9000 higher than 11,563 what we estimated from January Inventory. This tells us that January Inventory is totally bogus with respect to EB2-IC demand and should be ignored. Again if these are not EB2-IC numbers then any reduction in here should be accounted by increase in EB1, EB2-ROW, EB4 or EB5 demand, which by all means suggest less contributed spillover to EB2-IC. Based on this March 2008 PD total demand for this year becomes

EB2-IC demand March 2008 =  8000+ 20,720 + 1,800 = 30,520

Now based on current EB1 and EB2-ROW demand, we are estimating that spillover for this year can be as high as 35,500 and as low as 28,800. So it still means June-July 2008 PD can receive green card this FY 2012. My personal opinion is that due to long processing time at USCIS, DOS may not have to retrogress dates all the way to June-July 2008 and then move them again in FY 2013.So this means we can still see October 2008 PD to be current for the remaning fiscal year. USCIS may approve cases more likely on basis of PD than receipt date. EB1 demand will be a gate keeper for this year based on USCIS efforts to reduce this huge inventory. EB2-ROW-M-P demand may yield more spillover compared to last year.

Summary
  • USCIS inventory was not indicative of real EB2-IC demand. We were fooled by those low numbers. Current Receipt data suggests that EB2-IC demand upto March 2008 PD is capable to use 30,520 visa numbers.
  • PD June-July 2008 should expect Green Card this year with dates still hovering around October 2008 - November 2008 incase DOS decides to avoid severe retrogression and moving dates again in FY 2013.


Monday, February 6, 2012

Prediction for EB2 Category for FY 2012 - Employment Based Green Card

Posted On Monday, February 06, 2012 by Rav 60 comments

Here is the Prediction for EB2 Category cutoff date retrogression for Fiscal Year 2012. Basis for this prediction is simple calculations (see below) which is done based on available data i.e. PERM data published by DOL, I-485 Inventory data, latest trend on Trackitt for EB1 & EB2 cases and other published data by USCIS. Demand data for each dependent category is predicted and explained in calculations below. This data is further used to calculate spillover that would be available for EB2 category. Retrogression is estimated based on visa allotment available each year for each country and total spillover that is expected in FY 2012. In each case, Optimistic, Realistic and Worst-Case scenario is estimated.

Based on newly released USCIS Receipts and Approvals for Q1-FY 2012, we would like to adjust the estimation of retrogression for FY 2012 for EB2-India & China Category. See this article for detail.


Summary of article

  • USCIS inventory was not indicative of real EB2-IC demand. We were fooled by those low numbers. Current Receipt data suggests that EB2-IC demand upto March 2008 PD is capable to use 30,520 visa numbers.
  • PD June-July 2008 should expect Green Card this year with dates still hovering around October 2008 - November 2008 incase DOS decides to avoid severe retrogression and moving dates again in FY 2013.
EB2-IC PERM to Inventory factor is a User ENTERED' field and can be changed accordingly. 


You can also play with EB1, EB2-ROW-M-P, EB4 and EB5 demand to get your own estimate. Please read this article to estimate their respective demand.

Estimation on Retrogression - Last Updated - 26 February 2012

We do not expect to achieve any spillover from Family-Based category.


Detailed analysis on Visa Demand data for each category could be seen below in the calculations.


You can enter porting and visa demand for each category in 'User ENTERED' box for your Priority date, and see if your PD would be current with those assumptions.

This Prediction will be updated as and when more data is published - Last Updated 26 February 2012

Notes

Understanding Spillover
Spill Across (SA): It is a horizontal reallocation of visas within a category. (Unused number from EB2 ROW will be allotted to EB2 -India and China)
 
Fall Down (FD) : It is the vertical reallocation of visas between categories (eg: unused numbers from eb1 go to eb2....) Unused visa numbers in a higher preference level can "fall-down" to lower preference categories. For example, excess EB1 numbers can "fall-down" to EB2.


Fall Up (FU): Unused visa numbers in EB4 and EB5 can "fall-up" to EB1 then to EB2


EB2 - India-China Allocation (IC) - Visa numbers allotment to India and China EB2-category. This is 2,800 for each country or total 5,600.


How spillover works?

Unused EB4 and EB5 => EB1 => Unused EB1 => EB2 ROW => EB2 Retrogressed


Visa Allocation available each year

EB1 - 40,000

EB2 -ROW-P-M - 34,400

EB2-IC - 5,600

EB4 - 9,940

EB5 - 9,940


Calculations


Sunday, February 5, 2012

January 2012 I-485 Pending Inventory - EB Category Visa Use

Posted On Sunday, February 05, 2012 by Rav 0 comments

USCIS released I-485 pending inventory upto 12 January 2012. Please note this inventory is only for Service Centers and Field Offices, and does not contain consular processing cases. Dependents are included. Here is a summary of the I-485 inventory when compared to October 2011 Inventory. This inventory is used to estimate the visa use during Q1 of FY 2012 and Projected Demand for FY 2012.Please note that one fallacy to using inventory to estimate demand is that it will not consider cases approved in less than 90 days.

EB1 demand : In general, EB1 is highly backlogged with atleast 15,583 applications still pending at Service Centers. Although this number looks big at first glance please do not worry. This is just a backlog that USCIS will need to clear going forward. Rate of new application filings is very low and we can estimate at least 12,000 or more spillover from this category at current rate. This may change with time. It all depends how much USCIS will like to reduce it's inventory when crossing into FY 2013. Generally such number is around 8,000 year-to-year, and we have used this number to estimate our projected EB1 demand for FY 2012.


EB2-ROW-M-P demand - This category demand is little surprising at first. I am not sure if new demand is so low but we should remember that other significant demand for this category also comes from consular processed cases. Such demand is usually around 15%. Estimated Demand shown is only for USCIS and Field Offices. Usually year to year inventory for this category ends around 8,000 -10,000. We assumed 8,000 in our calculations.

If we will add 15% to the estimated demand, we can say that estimated FY 2012 EB2-ROW-M-P demand is around 1.15 * 22,379 = 25,735. From EB2-ROW-M-P, we can expect spillover around 34,200 - 25,735 = 8,465 or more

EB3-ROW-M-P demand - Visa use for for EB3-ROW-M-P is estimated from October 2011 to January 2012 inventory. Please see below.

 One thing to note here is that only 5,042 visa numbers were used by EB3-ROW-M-P at USCIS. Total visa number available for 3 months is around 8,682. Remaining 3,640 were used by consulates abroad. This demand is around 40% for CP cases.We are still marching towards 08 August 2006 for this category.

EB2-IC demand - This section of the article will only cover EB2-India and China demand till PD July 31st, 2007. This demand is all inclusive of visa numbers that are/will be used upto this PD for current fiscal year (FY 2012). Demand from October 2011-January 2012 inventory estimates visa number used until Q1, cases still waiting for visa numbers and new EB3 to EB2 porting cases. Remaining demand after PD July 2007 is covered in "Predictions for EB2-India & China FY 2012".

Just based on inventory it seems that only 7,795 visa numbers were used in Q1-FY 2012. Total PWMB numbers are also very less compared to what we initially thought. PWMBs includes all PDs from May 2006- July 2007 (June VB-November VB) that are still pending since October 2011 inventory. Visa use for such cases will come from this year's quota. These 14,430 demand will be limiting factor for current year cut-off date on retrogression. Retrogression will be estimated is next article.

EB3- India - Inventory for EB3-India compared to last fiscal year reduced by 4884 (2803 annual limit + 2081 estimated porting and/or case abandonment upto January 2003). Minimum movement around 08 November 2002 is expected. Movement can be little more if more folks from November-December 2002 will port for this year.

EB4- demand - Last year, EB4 demand was high or at par, and hence no spillover was received from this category. For this year also we may assume that no spillover will be received.

EB5- demand - EB5 demand is similar level as last year and may yield around 3000-4000 unused visa numbers if similar demand is seen in FY 2012.


Saturday, December 31, 2011

EB2-India & China I-140 Demand (Yearly) based on DHS Released Report

Posted On Saturday, December 31, 2011 by Rav 32 comments

DHS on 29th December 2011 released a Citizenship and Immigration Services Ombudsman's recommendation to improve the quality in Extraordinary Ability and Other Employment based petition adjudication document (thank you to our reader who pointed to this release) - http://www.dhs.gov/xlibrary/assets/cisomb-recommendation_extraordinary_ability_petitions.pdf.

Some of the important relevant information can be found on Page 6 of the document which has plots for I-140 EB1 and EB-2 adjudications, including receipts and approvals for the Texas (TSC) and Nebraska (NSC) Service Centers. Report suggests that USCIS has experienced a slight downturn in EB-1 and EB-2 filings over the past five years for both EB-1 and EB-2 (note report does not include National Interest Waiver petitions), with approval and denial rates remaining consistent.

Key point to note here are - 
  • EB1-A and EB1-B has high rate of denial rate, around 40% to 60% respectively. 
  • EB2 I-140 approval rate is close to 100%
  • Respective I-140 filings for each fiscal year 2008, 2009, 2010 and 2011.
  • EB1 majority demand comes from EB1-C and not from EB1-A and EB1-B. Those filings do not look enormous.
Based on I-140 receipt data  and 100% approval rate for EB2 petition, we tried to deduce some I-140 demand for PD 2008, 2009 and 2010.

EB2-India & China I-140 Demand based on released data

First of all we started after taking into account the PERMs that were approved for the FY 2008, FY 2009 and FY 2010.

Table I

We know from past analysis that usual break down of PERMs are 65%-35% for EB2-EB3 for India and China, and 50% for EB2-ROW-M-P.  Based on this assumption and 100% approval rate, total I-140 demand for PERMs filed each fiscal year as follow.

Table II
 If we now compare this data with recently released DHS document -http://www.dhs.gov/xlibrary/assets/cisomb-recommendation_extraordinary_ability_petitions.pdf. ; then I-140 Receipt numbers come very close to that suggested in above table. Approvals per released DHS document is as follow:


Table III
Reason for difference in two numbers can be accounted based on
  • First of all data is based on PERM approvals and some of demand from past fiscal year will roll-over into current fiscal year I-140 demand due to time lag between approval of PERM and filing of I-140s
  • Our assumption of 65% and 50% is flat and there may be a difference month to month.
  • Please note NIW applicants do not have to file PERM and hence that difference in negated here. 
In addition to above numbers we should remember that lot of PERM cases that were filed with PD 2008 and PD 2009 were audited  and were later approved in FY 2011. Few cases were approved in FY 2010 but we will neglect it for time being. If we will look at the EB2-IC and EB2-ROW-M-P breakup for FY 2011, we can see demand from PD 2008 and PD 2009 that will come from approvals in FY 2011.

This data comes from these articles
a) FY 2011 Q1-Q2 PERM data
b) FY 2011 Q3 PERM Approvals
c) FY 2011 Q4 PERM Approvals


Table IV
 Please note that from above table it is difficult to deduce EB2 I-140 Receipts of 39000 reported in DHS document. Our estimation only shows 21,034 receipts. This is still a mystery to us.

EB2-India & China demand based on Priority Date
To calculate this for now we can neglect the difference that we see in DHS I-140 Receipts data (Table II)  and I-140 demand data from PERM approvals (Table III), then we can roughly estimate total EB2-IC I-140 demand for each fiscal year just by using Table II. In order to capture FY 2011 approvals for old priority dates, we will add EB2-IC demand for each fiscal year to respective approvals in FY 2011. Based on above calculations, estimate for EB2-IC I-140 demand is  (in red)


Table V

Some key points to note
  •  I-140 Receipt demand will always lag PERM Approval times.
  • Difference between 29000 - 27588 = 1412 from Table II and Table III can account for some demand before October 2007.
  • It is assumed that most of the cases for certain priority date is approved in same fiscal year, so total demand upto end of FY 2010 will be same but real numbers for each  PD may be off depending upon PERM approval time within that fiscal year.
  • These calculations do not consider any abandon cases due to individuals leaving country, getting lay-offed or re-filing due to long audit processing time, multiple PERM factors or double filings within a family. You can assume anything from 65%-85% for this as a multiple PERM factor.
  • This data does not consider any EB3-EB2 portings.
  • You can multiply this demand by 2.0 to 2.25 based on dependent factor to get estimate of I-485 demand.


 EB2-India & China I-485 demand based on Priority Date

 To above numbers you can add 8000 visa numbers that was approved for this fiscal year. Also add demand from August 2007-September 2007 plus 4000-5000 PWMBs overall and then based on your estimation of spillover calculate cut-off date on retrogression.


My take will be the option Multiple PERM factor of 75%.
EB2-IC demand , August-September 2007 from PERM data = 4,000
All PWMBs =                                                                             4,500
EB2-IC Approvals for backlogged cases =                                8,000
Demand until Sep 2008 =                                                         25,233
__________________________________________________________
Total I-485 Demand upto September 2008 =                           41,733 

Spillover + annual limit expected at most can be around   28,000

Cut-off Dates for this year can hover around March-June 2008 after retrogression for the best scenario.


Thursday, July 14, 2011

EB2 India & China - What to expect in FY 2012? - (Post Sep VB)

Posted On Thursday, July 14, 2011 by Rav 228 comments

Cut-Off Dates has reached PD 15th April 2007 for EB2-India and China for FY 2011 in September bulletin, now what can we expect for FY 2012?

What movement do we expect for EB2-IC in FY 2012? 

Since now we know that EB2-India and China are stuck at 15th April 2007 for this fiscal year, we can try and estimate what we can expect for this category in FY 2012.

Eb2-India and China still need 8000 more visas for EB2-IC to cross PD 15 August 2007. This is calculated plainly from the currently released visible demand data, without including 'People Who Missed the Boat" (PWMBs) during July 2007. Expected PWMB until 15 August 2007 cut-off date from September Visa bulletin cut-off date of 15 April 2007 are 8302. We firmly believe any PWMBs before July visa bulletin cut-off date of 08 March 2007 have good chance to get approved by September 30 or even in October, where USCIS usually tend to use some unused visa numbers from the last fiscal year.

So out of total PWMBs of 8,302 for EB2-IC until 15 August 2007, even if we assume that due to the economic recession and other unforeseen reasons, only 50% are eligible to pursue this, numbers still come out to be 4,151. So to sum up, without even crossing EB2-IC PD of July 2007, for next fiscal year EB2-IC has demand of 8,000 + 4,151 = 12,151.

Now we know as and when these PWMBs will become current and file for I-485 in order to become documentarily qualified, by that time we will be in Q2 or beyond for FY 2012. Based on annual limits and not considering any PWMBs, expected movement for EB2-IC is as tabulated below. This is based on no porting and no PWMBs. 

For EB2-India, movement will be very small or expect no movement for first quarter (Q1) and then in Q2 we can expect 1 week movement each month until DOS will try to intake extra inventory in Q3. EB2-China will progress much quicker than EB2-India. For EB2-China we can expect 4 weeks in Q1 and Q2 each, until DOS will allocate any extra movement to intake inventory for spillover season.


EB3-EB2 Porting and PWMBs before 15th April 2007
Above tabulated estimation can all change, especially for EB2-India, if individuals in EB3 category with PD before 15 April 2007 will start porting. We expect EB3 to EB2 porting for FY 2012  will be at same level as FY 2011. Expected numbers should not be more than 2,800. Other than these porting numbers we should also consider calculated PWMBs before 15th April 2007, which are 1,958. Again assuming that out of these only 50% are still eligible, this number comes out to be around 979. Out of these we expect 50% or more will use visa numbers from FY 2011 quota. So rollover backlog to FY 2012 will be 488.

So EB3 to EB2 Porting and PWMBs before 15 April 2007 that would be counted towards FY 2012 becomes 2,800 + 488 = 3,288. Of course, porting demand will be realized slowly and hence we can expect little but small movement for EB2- India. Movement depends on PWMB rollover and new porting demand. EB2-China should continue to move as outlined above as we expect no porting, and we expect FY 2011 rollover PWMB demand to be around 150 or less.


What will be the total demand for FY 2012 and how much spillover is required to cross 2007?
So now going back to total demand for FY 2012 as calculated above up to 15 August 2007 and adding demand for PWMBs up to cut-off at that time (4,151- 2,803 = 1,351) assuming dates around 01 June 2007), porting and rollover PWMBs and removing annual limit, (5600) total demand required to cross PD July 2007 (see large font numbers above)

8,000 +1,351 + 3,288 + 150 – 5,600 = 7,189

Total demand of 7,189 will be enough to keep DOS from worrying about taking any new inventory until April 2012. Once year will progress into early Q3, just like this year DOS may start looking into half yearly projected demand for EB1 and EB2-ROW. If at this point, annual visa limit for the EB2-IC (or any of the country) is exhausted due to above stated demand, DOS will start looking into using any available unused visa numbers. Although, DOS/USCIS are constrained to use only 30% of these numbers in first three quarters (but they made exception this year), this move would totally depend upon number of visas available.

If DOS feel there is more than 7189 unused visa numbers that they can expect based on past number use; estimates of future number use and return rates; and estimates of Citizenship and Immigration Service demand based on cut-off date movements (quoted from our previous article), they will plan on taking extra inventory to make I-485 cases documentarily qualified for rest of the fiscal year Usually past trend has been around 3000 visa numbers each month for EB2-IC. 

So if expected spillover from half-yearly unused number is 10,000, they will try to intake for 18,000 or less, thus EB2-IC movement will be based on 18,000 – 7,189 = 10,811, thus crossing only 4-5 months from July 2007 at most at first trial and error. If after this movement, in case DOS would see change in demand pattern then they can try to retrogress dates or progress dates in July 2012 (Q4). Next fiscal year ,spillovers can either be used on a quarterly basis or we can expect some big movement in April 2012 and then second recalibration in July 2012.

If first trial and error would cause dates to move until PD December 2007 in early Q3 of FY2012; based on our estimation it will bring 11,664 EB2-I applications; 2,109 more EB2-C application; and  2803 new PWMBs post 01 June 2007 that were not considered above. These EB2-IC numbers comes from PERM data after applying I-140 conversion factor of 78%. After applying this, if we consider most optimistically due to economic recession or other unforeseen reason only 75% are eligible to pursue this anymore, total demand from Aug 2007 until December 2007 becomes  – (0.75 x (11664+2109)) +2803 = 11912 + 2803 = 14715.

Based on above 18,000 spillovers, 10,811 left after July 2007 would only take EB2-India and China to end of November 2007, and dates could retrogress from December 2007 in July 2012 . If we expect next year’s spillover will be same as this FY 2011 (very unlikely), and we will receive 25000 unused visa numbers, EB2-IC in FY 2012 will end up around January 2008. In reality dates can be anywhere between December 2007 to January 2008 for FY 2012.

It should be noted in above scenario I-140 to I-485 conversion is assumed 75% and PWMBs are assumed 50% eligible.

Now final question is if dates will retrogress or move forward after first huge movement in early Q3 for next fiscal year?
We are really hoping that DOS/USCIS should use quarterly spillover than half yearly spillover for next fiscal year. But Mr. Oppenheim being conservative in nature will move dates only in early Q3 around April 2012 and then recalibrate in July 2012. Dates retrogressing or moving forward will totally depend upon EB1 and EB2-ROW demand.

Do we expect retrogression in Q1 for EB2-I?
No, we do not expect retrogression for EB2-I in Q1 FY 2012. In case if that will happen, it will not be more than a month. Chances are very less.  


Saturday, April 30, 2011

EB2 - ROW-Mexico-Philippines Visa Demand FY 2011 - Based on PERM Data

Posted On Saturday, April 30, 2011 by Rav 14 comments

We have analyzed the PERM data for FY 2011 Q1 and Q2, and FY 2010 Q4 (Aug-Sep) for EB2-ROW-M-P to ballpark current visa demand for this category. Goal behind this was to see if there is a possibility that some spillover from EB1 would be consumed by EB2-ROW before it will come to retrogressed EB2 countries. The reason behind using the FY 2010 month of August and September for the analysis was to consider the only demand from last fiscal year that is not considered in the September bulletin.. Please note that September bulletin is usually released in first week of August and hence any demand later than that is not considered during that bulletin. Though some of the cases are processed in the same fiscal year but gap time between PERM approval and submission of concurrent I-485/I-140 is minimum one month. So there is less likelihood that this demand was ever seen in FY 2010. We expect that all this demand was seen early this fiscal year.

Again to segregate PERM data in EB3 and EB2, 'minimum wage required' of less than $55000 was used as a criteria. Please note minimum wage required is different than wage offered. Any PERMs that would require wages above $55,000 were considered EB2. Though there is some error to this assumption, but this should give you rough idea about fair distribution. We understand that minimum wages required differs from state to state, and in some cases wages offered at universities and higher education institutes are lower but job requirements still qualifies you to EB2 category. All these errors in our assumptions for considering EB3s with higher minimum salary into our EB2 criteria and not considering EB2s from higher education institutes due to lower salary will offset each other. In order to complete an informed analysis, it was necessary to make some kind of assumptions.

That said, data was used to calculate total demand based on primary and dependents. On average family size used was 1.75. Further, this data was extrapolated for rest of the fiscal year only based on high demand seen in February and March. Data was extrapolated until July 2011 (reason same as explained before about release of September visa bulletin in first week of August).

What does this mean for EB2-ROW-M-P
This means PD dates for EB2-ROW-M-P will reman current for remaning fiscal year. For EB2-ROW if demand will pick up more than predicted, they can always use unused visa numebrs from EB1 category.


What does this mean for EB2-IC?
Expected EB2-ROW-M-P demand for current fiscal year will be around 28,599 +/- 1,000. Current fiscal year quota for EB2-ROW-M-P is around 34,400. Expected spillover is around 5000-7000 from EB2-ROW-M-P. Any increase in demand for EB2-ROW alone means consumption of some EB1 category unused visa numbers. EB2-M-P will yield atleast 2800 unused visas.


EB2-ROW-M-P Demand absed on PERM data


Tuesday, March 29, 2011

EB2 Category will see atleast 12,000 Spillover from EB1 for FY 2011

Posted On Tuesday, March 29, 2011 by Rav 21 comments

As per recent statement by Mr. Charlie Oppenheim, Chief, Immigrant Visa Control and Reporting Division, U.S. Department of State, it appears that India EB2 cutoff dates will advance, perhaps substantially, in May. This means that China EB2 cutoff dates will also advance with them.

Mr. Oppenheim said “[US]CIS says they have seen a decline in filings, and does not expect a change in the number use pattern. Therefore, this decline in EB-1 number use will allow me to begin having those ‘otherwise unused’ numbers drop down and be available for use in the EB-2 category. Based on current indications, that would mean that at least 12,000 additional numbers will be available to the EB-2 category. This situation will allow me to advance the India EB-2 cut-off date for May. The reason being that all ‘otherwise unused’ numbers are provided strictly in priority date order, and the India demand has the largest concentration of early dates.”

Statement in red could be read in two ways

a) This means bare minimum 12000 will be available for entire fiscal year based on current indication or trend.
OR

b) This means 12000 visa numbers are available from EB1 right now and we can expect 24,000 unused visa numbers for rest of the year.

On a conservative side, I would think at least 12000 unused EB1 visa numbers will be available for spillover for the entire fiscal year. Apart from this we could also expect spillover from unused EB4, EB5 and EB2-ROW-P-M category later in the last quarter.

But contradictory to a) is the statement published on the other website which suggests "The Department of State announced that the Indian EB2 category is expected to advance one week in the May Visa Bulletin. The demand for EB1visa numbers has decreased by 50 percent this fiscal year. Last year from October 2009 to February 2010, 22,000 EB1 numbers were used. During the same period this year, only 10,000 to 11,000 have been used. EB1 will be current worldwide all fiscal year. This will free up an estimated 12,000 visa numbers to fall down from EB1 to EB2 this year."

Please ignore the statement on movement by only one week, which seems little too unrealistic. If we closely look at statement in red, this suggest at least 18000 spillover from EB1 to EB2 category this year.

Based on above two scenarios, a) and b), we will update our "May visa Bulletin Prediction" and "Prediction for EB2 Category for FY 2011".

Indeed this is a good news for EB2-India and China applicants who are waiting for some visa numbers for long time.


Wednesday, February 9, 2011

Demand Data and EB3-EB2 Porting Calculations

Posted On Wednesday, February 09, 2011 by Rav 3 comments

Demand Data that is used to determine cut-off dates for Employment Based Category has been released. You can find Demand Data here. Based on released demand data, visa demand for EB2-India to reach 01 January 2007 has increased from 13,150 to 13,175 from February 2011 to March 2011. This portends that EB2-India will not see any movement in March 2011 Visa Bulletin.

Demand Data for EB2-India for last 4 months

Cumulative Demand

Dec 2010

Jan 2011

Feb 2011

March 2011

01 January 2007

13,150

13,125

13,150

13,175


How to use this data to predict EB3-EB2 porting?

As per visa allocation each year under each category, USCIS/DOL should use 233 visas every month for EB2-India. Normally this should reduce demand by 233 every month. Since we are not seeing any reduction in demand data, it suggests that there are many individuals who are upgrading their case from EB3 to EB2. So what is the rate at which EB3 to EB2 porting is happening? Simple Calculations that could be used to estimate this is

EB3-EB2 Porting = (Demand for current month) - (Demand for past month) + 233


Dec 2010

Jan 2011

Feb 2011

March 2011

EB3-EB2 Porting

258

208

258

258


This suggests that on an average 260 cases are ported every month. This brings total to 3120 cases for a year as long as this trends continue.

Fallacy to above calculations
One fallacy to above method is 'Hidden Demand'. We are not sure about number of ported cases that are received and approved same month due to interfiling. This is what I call 'Hidden Demand', as it could not be accounted for in each month's released demand data. On an average it is taking 20 days to get a green card for a case which is ported and is already pre-adjudicated to use visa numbers. So these cases may not show up in demand data.

How to evaluate current trends in EB3 to EB2 porting?
There is no simple way to predict current trend in EB3 to EB2 porting. One way that I plan to estimate current trend in EB3 to EB2 porting is use of Google Analytics. With Google Analytics, I can drill down to each content on this website and see number of "unique visits" that I have received on each topic every day. This data is well plotted on Google Analytics and could be shared on this blog. This could at least help in breaking down number of individuals who are thinking or actually porting from EB3 to EB2. Results could be complete morass, but I think this can throw a little light on current trend in porting.

Currently this website has three posts on EB3 to EB2 porting.
I plan to analyze each of these posts to predict EB3 to EB2 porting numbers. I believe individuals visiting these topics are either thinking of porting their cases or are in middle of filing new PERM under EB2 category. This data could be leading indicator for the demand that may hit in coming months. The data set that I have analyzed so far suggests on average '20' unique visitors are interested in reading one of the above topics. If we assume that 80% of these individuals are either thinking of porting their cases or actually eligible to porting, number comes around '480' individuals for a month and around '5760' cases for a year. But again this is a small data set with lot of uncertainty. I plan to collect data until second week of March and further analyze it to share results here on website.